The visibility matrix: every question, every assistant, every draw
One screen that shows where you stand: your customer questions as rows, ChatGPT, Gemini and Claude as columns, and per cell how often your brand appears in the answer.
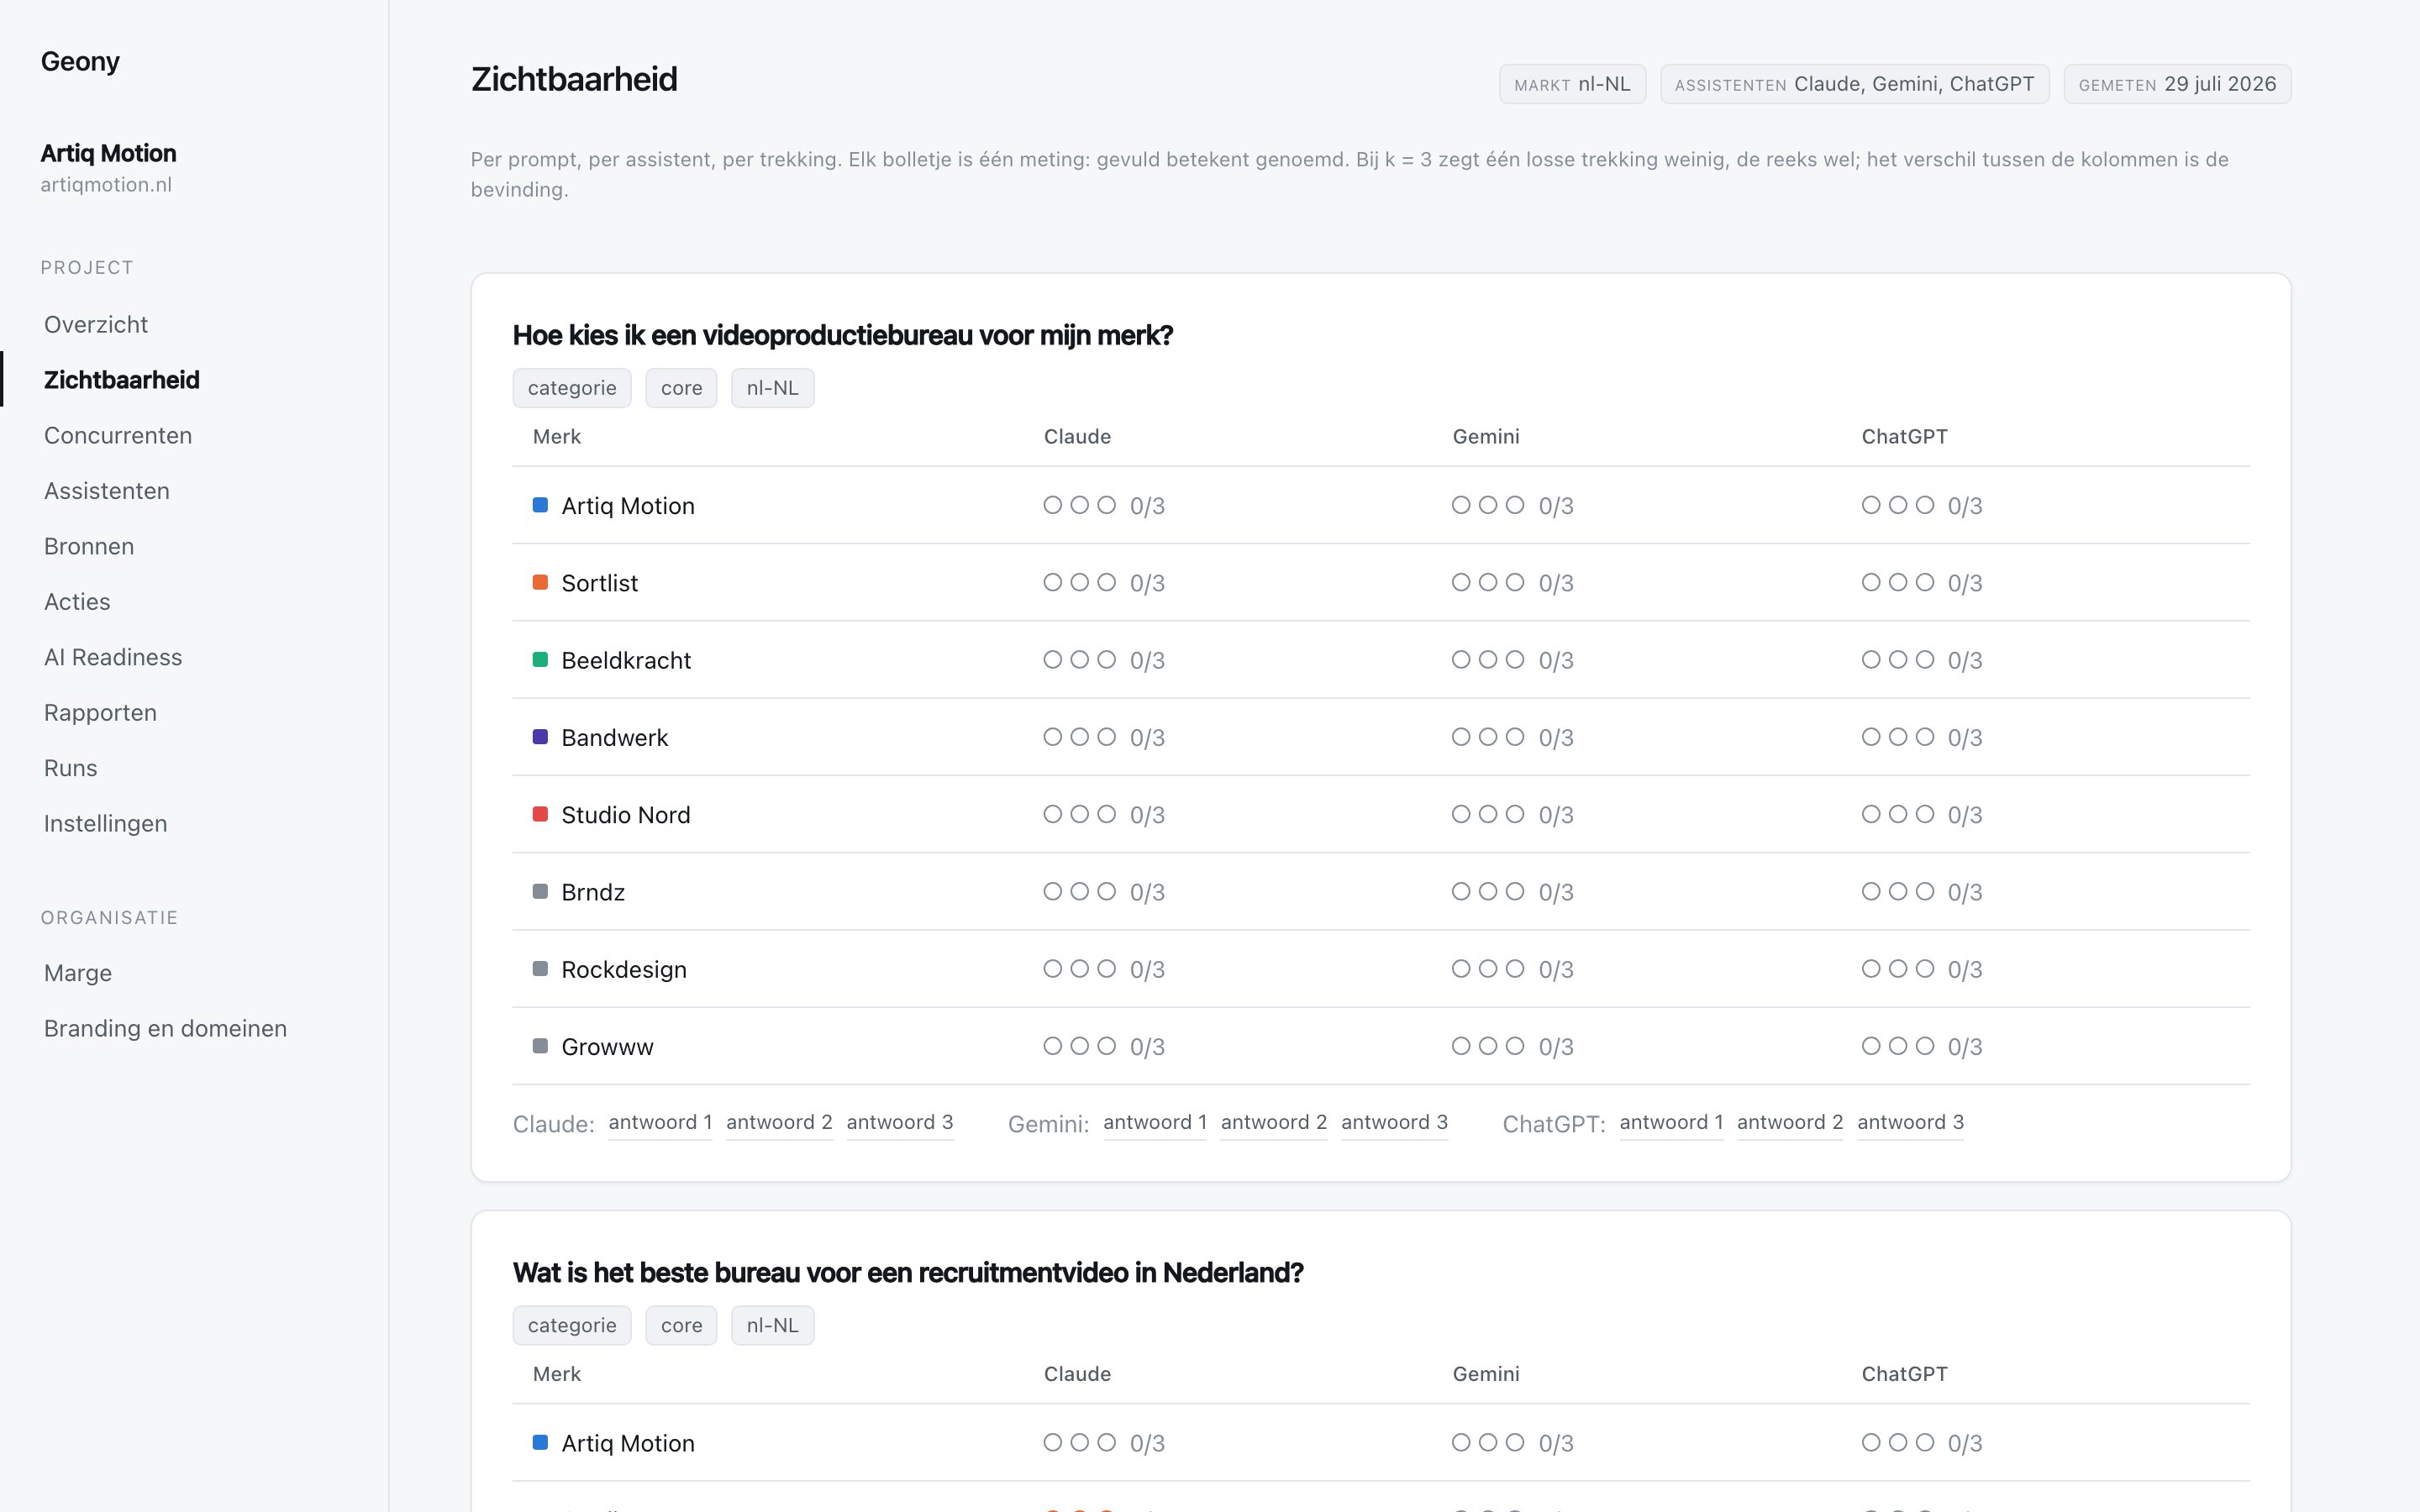
Per cell: mentioned or not, average position, and the full answer one click away.
How it works
- →Per cell you see the percentage of answers your brand appears in, with a confidence bar and your average position.
- →Click a cell and you read the literal answers, with your brand and every competitor highlighted in its own colour.
- →All repetitions of a measurement sit side by side, because AI answers differ every time; making that difference visible is exactly the point.
- →Filters for market, assistant, question type and dropped-only, so on Monday you start where it hurts.
Why it is built this way
One average visibility figure hides more than it tells. A brand can vanish entirely at one assistant while the average stays flat; the matrix shows the difference per assistant and per question, and every cell traces back to the real answers it is based on. What you can verify, you can also defend, to your board or your client.
One brand, three realities
In our own measurement pool the same brand appeared in 36% of Claude answers, 5% at ChatGPT and 1% at Gemini. The average of that is 14%, and that figure describes no single assistant. On the matrix you see in one glance that the work lies with Gemini, not with Claude, and you click through to the answers to read what is being said instead.
What it is not
the boundary, on purposeThe matrix invents no total score that presses everything into a single figure above the fold. There is a visibility score for the trend, but the matrix itself deliberately keeps the assistants and the questions apart: summarising is throwing away exactly the information you measure for.
Not a score out of a black box, but a matrix you can verify right down to the answer.
Frequently asked questions
How often is a cell refreshed?
As often as your measurement cadence is set, weekly by default. Every measurement round asks each question again multiple times to each assistant, so a cell is always a fresh sample and not a stored verdict from weeks ago.
What does the bar in a cell mean?
That is the 95% confidence interval around the percentage. Three measurements with one hit is 33%, but the band runs from 6 to 79%; the bar shows how narrow or wide the basis under the figure is.
Can I view the matrix per market?
Yes. At the top there is a market selector; the same question in the Netherlands and Germany is its own row with its own outcome, because assistants answer differently per language and country.
Want to see how this looks with real measurements? View the demo, or start with the free AI check and see within twenty seconds whether you get mentioned.
Within a day you'll know whether AI mentions or ignores your brand
The first measurement runs on your own prompts, across three assistants, with real figures. No demo data, no sales call first.
Prefer to talk it over first? Book a call